Textile manufacturing plants select processes for transforming raw materials to products depending on what is appropriate for their products’ end uses. The three main end uses are clothing, home furnishing and industrial use.
The manufacturing processes can include fiber production, yarn production, fabric production (nonwoven, knitting, weaving), wet treatment, finishing and sewing. A textile manufacturing plant that performs all the processes from yarn production to product is commonly termed a ‘vertical plant’. The materials include well-known ones like cotton, polyester, viscose, lyocell, wool and silk.
Calculations of the carbon footprint of textile manufacturing plants are generally made within the context of an Energy Management Standards (EMS), an organizational carbon footprint or for the purpose of a product LCA. If the focus is the organizational level, the functional unit can be defined as one year of operation of the textile plant, regardless of which processes are present.
If the goal is a product LCA, allocation procedures are required, and the extent to which different processes are applied to the specific product under investigation needs to be considered.
Throughout the production processes for textiles, material is wasted, which means that the carbon footprint of the product has to be adjusted to consider the material losses from previous steps.
This means that carbon footprint data published about textile processes in the context of a product carbon footprints are not readily converted into carbon footprints of textile manufacturing processes or textile manufacturing plants unless background data are provided detailing the losses at different process steps.
‘Cradle-to-gate’ is a common expression in LCA indicating that raw materials are included but end use and disposal are excluded.
This is similar to ‘cradle-to-plate’ used in food LCA and is in contrast to ‘cradle-to-grave’ indicating an all-inclusive system analysis. Figure 2. 3 shows the cradle-to-gate carbon footprints from each of the textile manufacturing processes for a mixed material garment (a jacket) as calculated in the Mistra Future Fashion programme (Roos, Sandin,
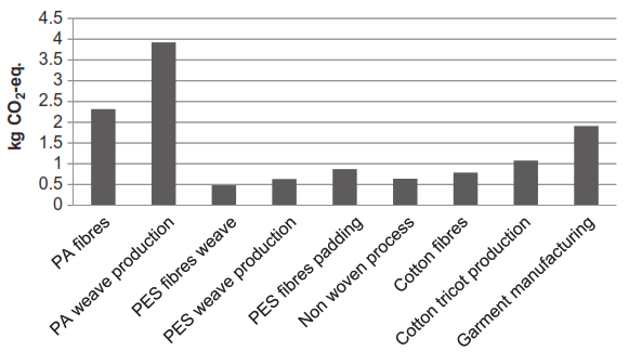
Zamani, & Peters, 2015). In the figure, the contribution of each manufacturing process is related to the fraction of the jacket that each material represents.
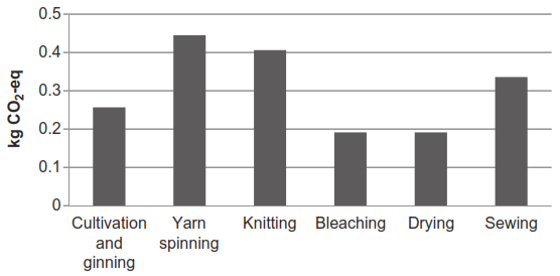
In contrast to Figure 2. 3, in Figure 2. 4 a mono-material garment is examined (a cotton T-shirt).
This makes the relative scale of the carbon footprint of each manufacturing step easier to grasp. As Figure 2. 4 indicates, yarn and fabric production, wet treatment, and sewing processes at manufacturing plants can make up a considerable proportion of the cradle-togate carbon footprint of a garment, compared to the cultivation step. Table 2. 2 shows a set of published carbon footprint studies of textile manufacturing plants, with a description of the method used for carbon foot printing, the studied reference flow (most often a product) and the calculated carbon footprint.


